Let’s dive into the top KPIs for digital transformation success. Many organizations fall short of their transformation goals because they get too caught up in activities without checking if they align with their objectives.
Enter Key Performance Indicators (KPIs). These are like guideposts that indicate if your strategy is on the right path. However, many teams struggle to identify the right KPIs or agree on their importance.
But without them, you’re flying blind.
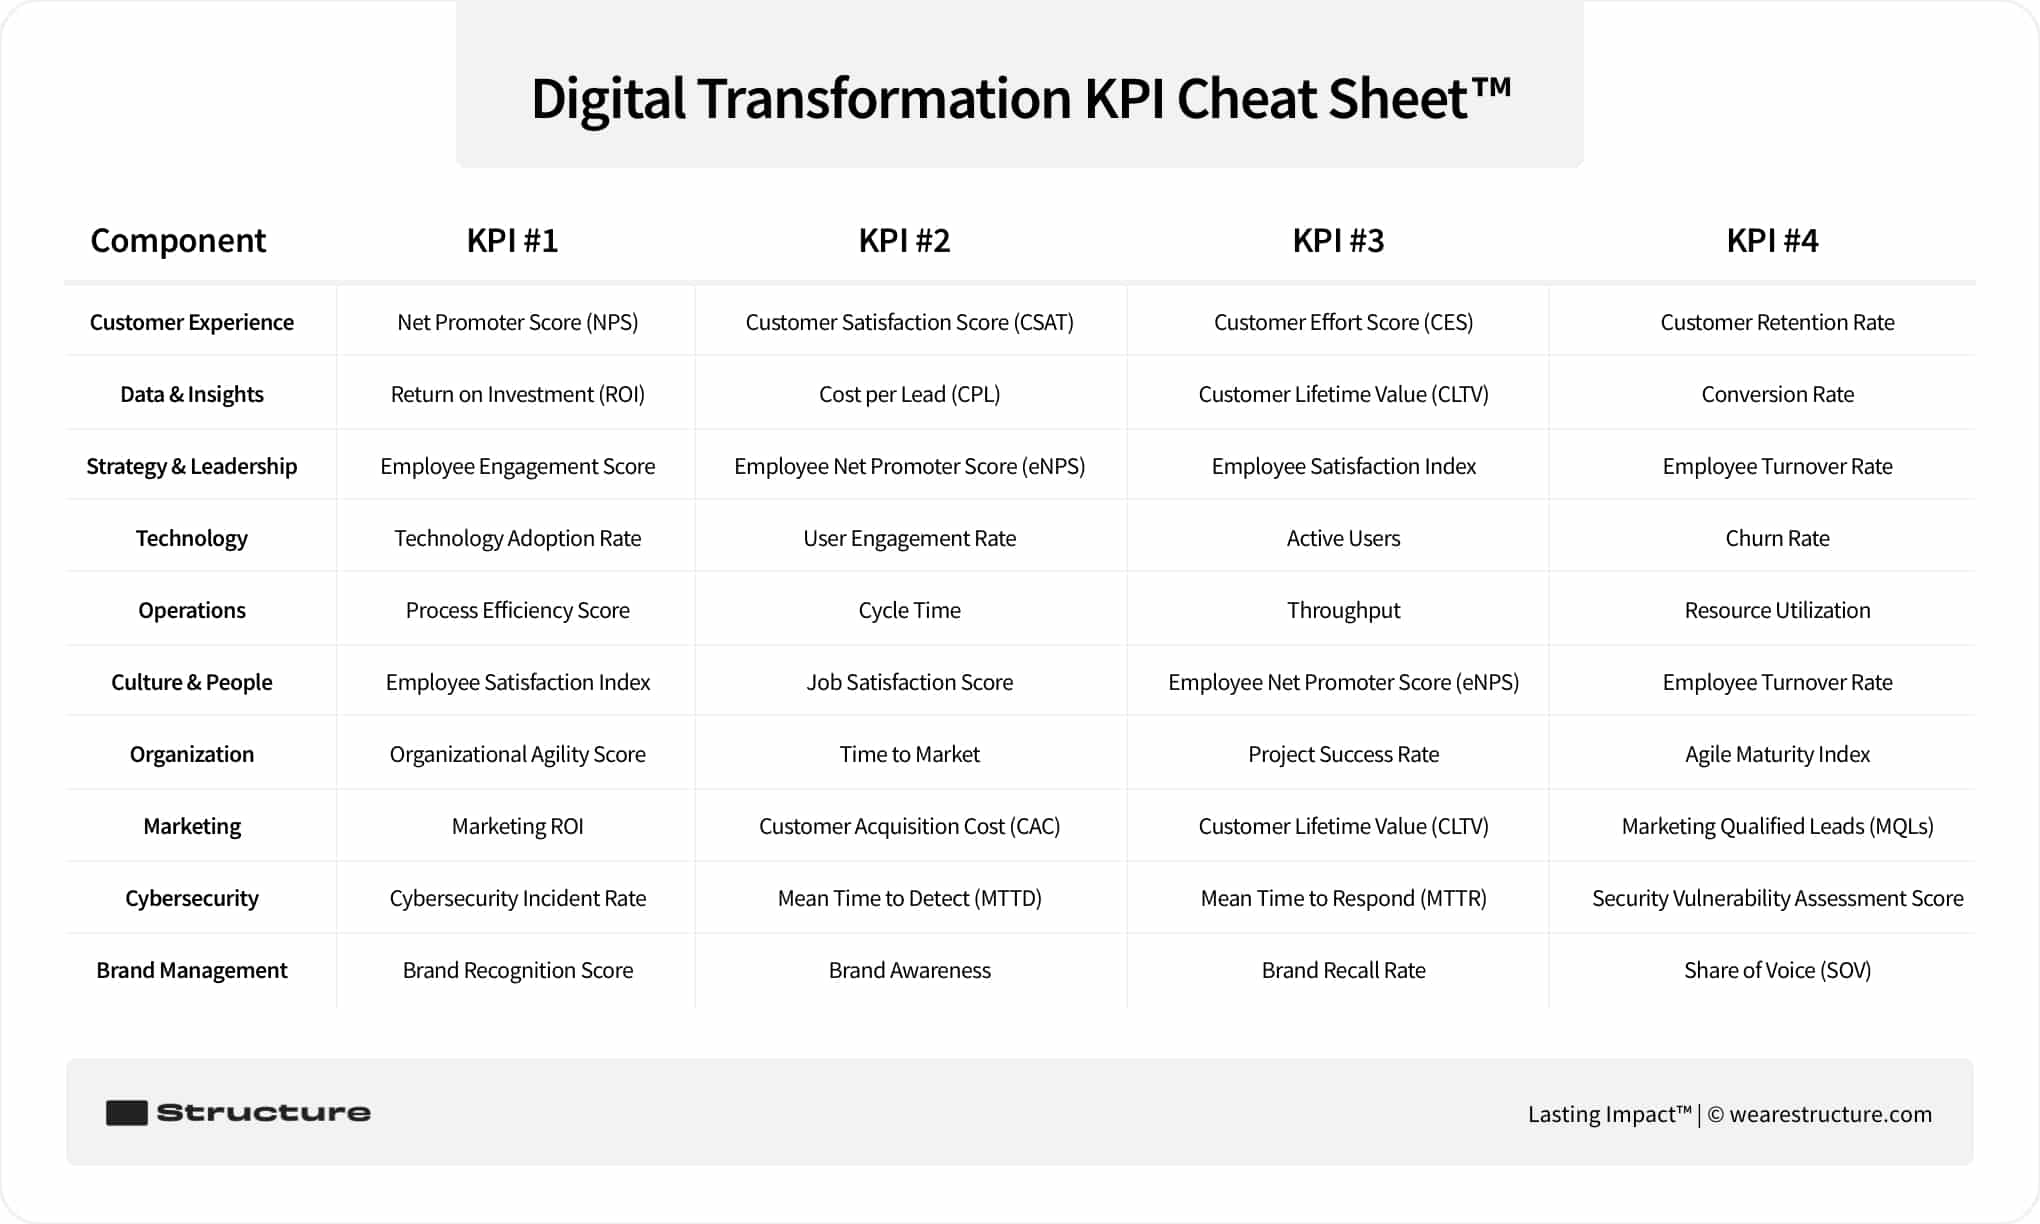
This blog post will outline ten crucial KPIs to consider during your digital transformation journey. We’ll link each KPI with one of the 10 Key Components of Digital Transformation™ and provide supporting KPIs to offer a comprehensive view of success in each area.
Get a FREE Customized Digital Growth Plan
Take our 10-minute Digital Maturity Assessment and receive a FREE, personalized digital growth score that uncovers gaps and drives your business forward.
Whether you’re leading a small business, a midsize logistics company, or a finance firm, these KPIs will show you if you’re making headway or just treading water.

Download the Cheat Sheet!
If you’re eager to get to the point or prefer a version you can download, print, or share, grab our Digital Transformation KPI Cheat Sheet™ for free.
What are the 10 Key Components of Digital Transformation™?
To map out primary and supporting digital transformation KPIs, you’ll need to understand each component. Here’s the rundown:
Here’s the shortlist:
- Customer Experience
- Data & Insights
- Strategy & Leadership
- Technology
- Operations
- Culture & People
- Organization
- Marketing
- Cybersecurity
- Brand Management
Now, on to the KPIs!
1. Net Promoter Score (NPS)
Customers rate their likelihood of recommending our company/product/service to a friend or colleague on a scale from 0 to 10, forming the basis of the Net Promoter Score (NPS).
An NPS score of 50 or higher signifies excellent performance, indicating incredible customer loyalty and advocacy.
Supporting KPIs:
- Customer Satisfaction Score (CSAT)
- Customer Effort Score (CES)
- Customer Retention Rate
2. Return on Investment (ROI)
To calculate ROI, divide the net profit generated from an investment by its total cost, then multiply by 100 to express it as a percentage.
Achieving an ROI of 5:1 or higher is considered good, indicating that the benefits derived from data analytics outweigh the costs invested.
Supporting KPIs:
- Cost per Lead (CPL)
- Customer Lifetime Value (CLTV)
- Conversion Rate
3. Employee Engagement Score
Employee engagement surveys collect feedback on job satisfaction, motivation, and loyalty, with scores calculated from survey responses.
An engagement score of 75% or higher indicates high employee satisfaction, motivation, and commitment to organizational goals.
Supporting KPIs:
- Employee Net Promoter Score (eNPS)
- Employee Satisfaction Index
- Employee Turnover Rate
4. Technology Adoption Rate
The technology adoption rate is calculated by dividing the number of users who have adopted a new technology by the total number of potential users, multiplying by 100 to express it as a percentage.
A 90% or higher technology adoption rate indicates widespread adoption and effective utilization of digital technologies across the organization.
Supporting KPIs:
- User Engagement Rate
- Active Users
- Churn Rate
5. Process Efficiency Score
A process efficiency score is calculated by evaluating the time, resources, and effort required to complete a specific process or task and comparing it to benchmarks or historical data.
A process efficiency score of 80 or higher indicates streamlined operations, reduced waste, and optimized workflows.
Supporting KPIs:
- Cycle Time
- Throughput
- Resource Utilization
6. Employee Satisfaction Index
The employee satisfaction index is calculated based on responses to employee satisfaction surveys, in which employees rate various aspects of their work environment, job role, and company culture.
A 90% or higher retention rate indicates strong employee satisfaction, loyalty, and retention within the organization.
Supporting KPIs:
- Job Satisfaction Score
- Employee Net Promoter Score (eNPS)
- Employee Turnover Rate
7. Organizational Agility Score
Organizational agility score is assessed through qualitative and quantitative measures, including the organization’s ability to respond to market changes, innovate, and adapt quickly.
Achieving an organizational agility score of 8 or higher on a scale of 1-10 indicates the organization’s ability to adapt quickly to market changes, innovate, and seize opportunities.
Supporting KPIs:
- Time to Market
- Project Success Rate
- Agile Maturity Index
8. Marketing ROI
Marketing ROI is calculated by dividing the net profit generated from marketing activities by the total marketing investment, then multiplying by 100 to express it as a percentage.
Achieving an ROI of 3:1 or higher indicates that marketing efforts generate significant returns relative to the investment, driving business growth and profitability.
Supporting KPIs:
- Customer Acquisition Cost (CAC)
- Customer Lifetime Value (CLTV)
- Marketing Qualified Leads (MQLs)
9. Cybersecurity Incident Rate
Cybersecurity incident rate is calculated by dividing the number of cybersecurity incidents or breaches by the total number of users or systems, then multiplying by 100 to express it as a percentage.
Responding to cyber incidents within 24 hours or less minimizes potential damage, data breaches, and operational disruptions.
Supporting KPIs:
- Mean Time to Detect (MTTD)
- Mean Time to Respond (MTTR)
- Security Vulnerability Assessment Score
9. Brand Recognition Score
Brand recognition score is assessed through surveys, brand recall tests, and market research to measure the level of awareness and recognition of a brand among target audiences.
Maintaining a brand recognition score of 90% or higher indicates strong brand recall and awareness among target audiences
Supporting KPIs:
- Brand Awareness
- Brand Recall Rate
- Share of Voice (SOV)

