Blog

  • Mastering B2B Buyer Personas: A 3-Layer Strategy for Deeper Connections

    Mastering B2B Buyer Personas: A 3-Layer Strategy for Deeper Connections

    If you’re finding it challenging to connect with your B2B buyers and B2B buyer personas, especially in today’s ever-evolving digital landscape, fear not.

    Today, I’m excited to share with you a strategy that has the power to elevate your approach and bypass the competition (it’s likely your competition isn’t going as deep as you dare to).

    Connecting with B2B Buyers & Your B2B Buyer Personas is Hard

    Let’s face it; the struggle to resonate with B2B buyers is real.

    But here’s the thing: most of us tend to stop at surface-level understanding. We glance over demographics and maybe scratch the surface of psychographics, but what about firmographics?

    What about truly understanding not just who our buyers are but what they care about and where they’re headed?

    Layer 1: Demographics

    Layer 1 of our strategy is demographics. Age, job title, location – these are undoubtedly essential pieces of the puzzle. But they’re just the tip of the iceberg.

    To truly connect, we need to dive deeper.

    Layer 2: Psychographics

    Layer 2 takes us into psychographics: attitudes, aspirations, and behaviors.

    Here lies the magic of alignment. When our values resonate with our buyers, and we solve real problems they care about, connections flourish.

    Layer 3: Firmographics:

    Layer 3 is where things get fascinating.

    Firmographics unveil the organization’s DNA—revenue, industry, and growth trends. Understanding the business landscape is key to speaking their language and crafting tailored solutions.

    The Deep Dive Challenge

    So here’s the challenge I present to you: Dive deep.

    Explore all three layers of buyer personas. Understand your buyers like never before. When you do, your messaging, your channels, and everything else will resonate more profoundly than ever.

    B2B Buyer Personas: The Bottom-Line

    Mastering B2B buyer personas isn’t just about ticking boxes.

    It’s about embracing a mindset of curiosity and empathy. It’s about seeing beyond the surface and uncovering the rich tapestry of who our buyers truly are in your industry.

    So let’s embark on this journey together, bypassing the competition and forging authentic connections.

    Are you up for the challenge?

  • The Power of Using 3 Tiers of Growth Metrics for Team Success

    The Power of Using 3 Tiers of Growth Metrics for Team Success

    Are you ready to take your organization to the next level? If you’re like me, you’re constantly seeking ways to drive growth, transformation, and success across the entire team. One key strategy I’ve found to be incredibly effective is implementing three tiers of growth metrics.

    Growth Metrics Tiers

    • Tier 1 Metrics: Topline Revenue & Sales
    • Tier 2 Metrics: Key Results & ROI
    • Tier 3 Metrics: KPIs & Progress Indicators

    Let’s dive in and explore how this approach can revolutionize the way you measure progress and empower your team to achieve greatness.

    You’ll learn how to drive success at every level of your organization by implementing tiered metrics that provide visibility and empowerment. Bridge the gap between executive goals and on-the-ground execution for maximum impact.

    Why Three Growth Metrics Tiers?

    In today’s dynamic business landscape, it’s not enough to simply focus on top-line revenue and sales.

    While these metrics are undoubtedly important, they only tell part of the story. To truly understand and drive predictable and repeatable success, we need to dig deeper and consider multiple layers of performance indicators.

    That’s where the concept of three tiers of metrics comes into play. By categorizing metrics into three distinct tiers, we gain a more comprehensive understanding of our organization’s performance and can tailor our strategies accordingly.

    Growth Metrics Tier 1: Revenue & Sales

    At the top of the pyramid are tier-one metrics, which encompass top-line revenue and sales.

    These metrics are crucial for CEOs, executives, and investors, as they provide a clear snapshot of the organization’s financial health. But while revenue is king, it’s not the only measure of success.

    Growth Metrics Tier 2: Key Results & ROI

    Moving down the pyramid, we encounter tier-two metrics, which delve deeper into key results and return on investment (ROI).

    These metrics, such as marketing qualified leads (MQLs), sales qualified leads (SQLs), and net promoter score (NPS), offer valuable insights into the effectiveness of our strategies and initiatives.

    Growth Metrics Tier 3: KPIs & Progress Indicators

    Finally, at the foundation of the pyramid, we find tier-three metrics—the KPIs and progress indicators that drive day-to-day operations.

    These metrics, which may include impressions, click-through rates, and domain ratings, provide tactical teams with the feedback they need to stay on course and make informed decisions.

    Bridging the Gap Between Executives & Execution

    One key challenge in implementing three tiers of metrics is bridging the gap between executive-level goals and on-the-ground execution.

    Leaders must communicate the importance of tier one metrics while also ensuring that teams understand how their day-to-day efforts contribute to the bigger picture.

    How to Put these Insights into Practice

    So, how can you implement three tiers of metrics in your organization?

    Start by aligning your goals and objectives with each tier, ensuring that everyone understands their role in driving success. Foster a culture of transparency and accountability, where teams have access to the metrics that matter most to them.

    And don’t forget to regularly review and refine your metrics to ensure they remain relevant and actionable. By continuously monitoring your progress and adjusting your strategies accordingly, you’ll be well-positioned to achieve your growth objectives and lead your organization to new heights of success.

    Growth Metrics: The Bottom-Line

    Effective measurement is key to driving growth and success.

    By implementing three tiers of growth metrics, you can gain a more comprehensive understanding of your organization’s performance and empower your team to achieve greatness.

    So go ahead, take the leap, and embrace the power of tiered metrics. Your organization—and your bottom line—will thank you for it.

  • How to Score & Prioritize Digital Growth Projects: I.C.E. Chart &  Project Prioritization Matrix

    How to Score & Prioritize Digital Growth Projects: I.C.E. Chart & Project Prioritization Matrix

    Do you often find yourself struggling to prioritize projects for yourself or your team? This can be digital growth projects or otherwise. If so, you’re not alone.

    Many marketing, business, and IT leaders face this challenge regularly. However, effective tools can help streamline this process and ensure that you focus on projects with the highest impact and results.

    In this video and post, we’ll explore two such tools: the I.C.E. Chart and the Project Prioritization Matrix (PPM).

    The Ice Chart: A Collaborative Approach

    The I.C.E. Chart is a collaborative tool that fosters team engagement and decision-making. Here’s how it works:

    1. Create a Table: Begin by creating a table with columns for “Idea,” “Result,” “Impact,” “Confidence,” “Ease,” and “Total.”
    2. Generate Ideas: Brainstorm project ideas and list them under the “Idea” column.
    3. Define Results: Determine what each project should achieve for your organization or team and note it under the “Result” column.
    4. Rate Each Idea: Rate each idea based on three factors: Impact, Confidence, and Ease (I.C.E.). Assign a score from 1 to 3 for each factor.
    5. Calculate Total Score: Calculate the total score for each idea by adding the scores for Impact, Confidence, and Ease.
    6. Prioritize: Rank the ideas based on their total score, with higher scores indicating higher priority.

    Example Using the I.C.E. Chart

    Let’s consider two project ideas:

    Webinar Creation:

    • Idea: Create a webinar to generate 100 marketing qualified leads (MQLs) this quarter.
    • Impact: High (10)
    • Confidence: Low (4)
    • Ease: Low (4)
    • Total Score: 18

    Blog Posts:

    • Idea: Publish blog posts to increase website traffic by 1,000 visitors.
    • Impact: Moderate (7)
    • Confidence: High (10)
    • Ease: High (10)
    • Total Score: 27

    Based on the I.C.E. Chart analysis, Blog Posts emerge as a higher priority due to their higher total score.

    The Project Prioritization Matrix (PPM)

    While the I.C.E. Chart offers valuable insights, it may not always capture the full picture. That’s where the Project Prioritization Matrix (PPM) comes in:

    1. Create a Square Matrix: Draw a square with four quadrants labeled “High Impact, Easy to Implement,” “High Impact, Hard to Implement,” “Low Impact, Easy to Implement,” and “Low Impact, Hard to Implement.”
    2. Rank Projects: Place each project from the Ice Chart into one of the quadrants based on its impact and ease of implementation.
    3. Prioritize: Focus on projects in the “High Impact, Easy to Implement” quadrant as they offer the most significant value with minimal effort.

    Implementing the PPM For Digital Growth Projects

    Continuing with our example, Blog Posts would likely fall into the “High Impact, Easy to Implement” quadrant, making them a top priority. Meanwhile, projects with low impact or high implementation difficulty may require further evaluation or long-term planning.

    Digital Growth Projects Bottom-line

    Both the I.C.E. Chart and the Project Prioritization Matrix are powerful tools for project prioritization for your digital growth projects and building a Digital Growth System.

    By utilizing these tools, marketing, business, and IT leaders can ensure that their teams focus on projects with the highest impact and achieve meaningful results.

    Whether you’re collaborating with your team or working independently, these tools can provide clarity and direction in your decision-making process. So, next time you’re faced with a list of projects, give these tools a try and watch as your team moves closer to achieving its goals.

  • 10 Key Performance Indicators (KPIs) for Digital Transformation Success

    10 Key Performance Indicators (KPIs) for Digital Transformation Success

    Let’s dive into the top KPIs for digital transformation success. Many organizations fall short of their transformation goals because they get too caught up in activities without checking if they align with their objectives.

    Enter Key Performance Indicators (KPIs). These are like guideposts that indicate if your strategy is on the right path. However, many teams struggle to identify the right KPIs or agree on their importance.

    But without them, you’re flying blind.

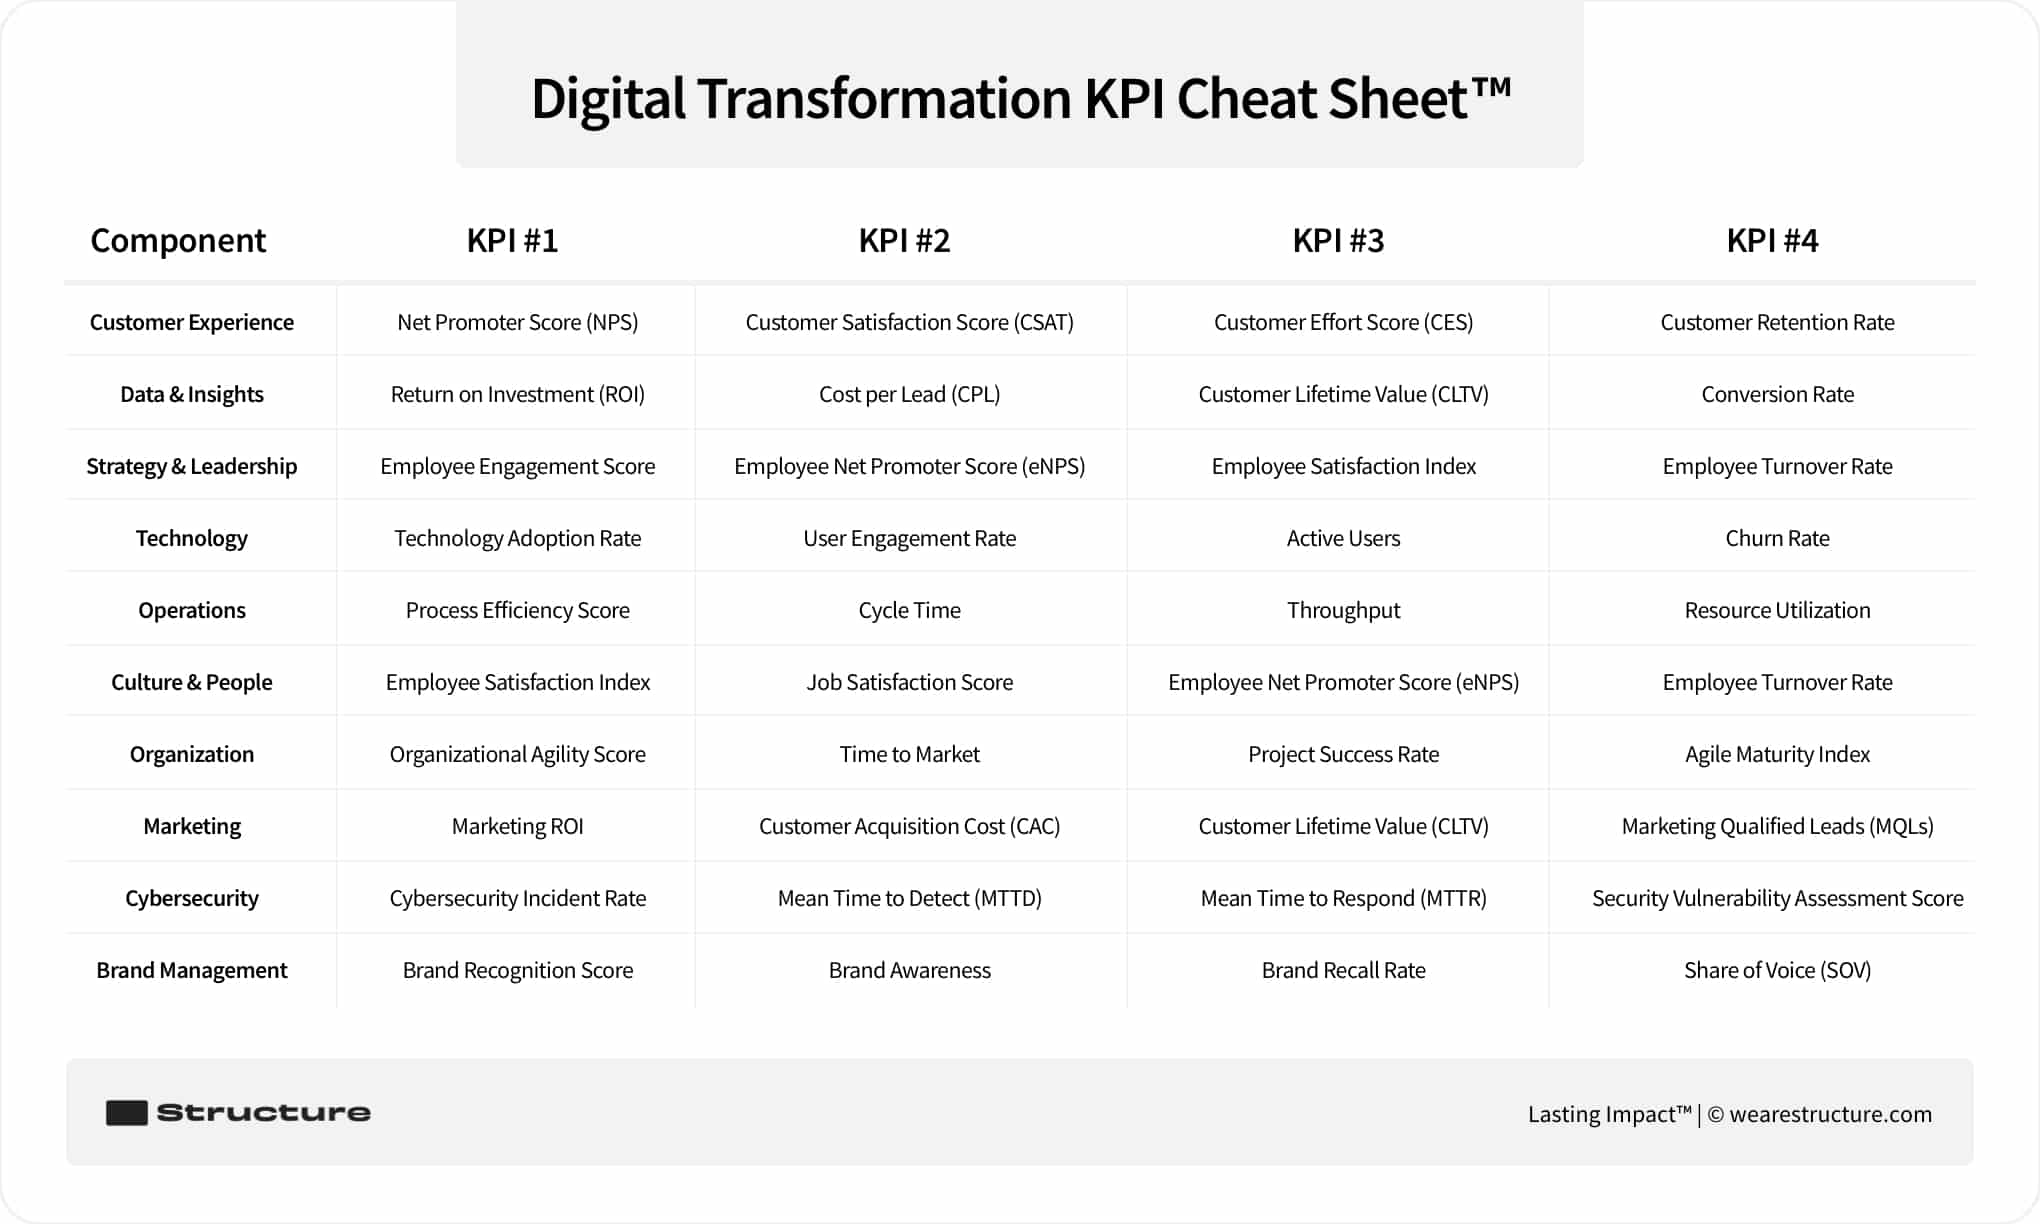
    This blog post will outline ten crucial KPIs to consider during your digital transformation journey. We’ll link each KPI with one of the 10 Key Components of Digital Transformation™ and provide supporting KPIs to offer a comprehensive view of success in each area.

    Get a FREE Customized Digital Growth Plan

    Take our 10-minute Digital Maturity Assessment and receive a FREE, personalized digital growth score that uncovers gaps and drives your business forward.

    Take the Free Assessment →

    Whether you’re leading a small business, a midsize logistics company, or a finance firm, these KPIs will show you if you’re making headway or just treading water.

    A detailed cheat sheet displaying various digital transformation KPIs, including NPS, ROI, Employee Engagement, Technology Adoption, and more.

    Download the Cheat Sheet!

    If you’re eager to get to the point or prefer a version you can download, print, or share, grab our Digital Transformation KPI Cheat Sheet™ for free.

    What are the 10 Key Components of Digital Transformation™?

    To map out primary and supporting digital transformation KPIs, you’ll need to understand each component. Here’s the rundown:

    Here’s the shortlist:

    1. Customer Experience
    2. Data & Insights
    3. Strategy & Leadership
    4. Technology
    5. Operations
    6. Culture & People
    7. Organization
    8. Marketing
    9. Cybersecurity
    10. Brand Management

    Now, on to the KPIs!

    1. Net Promoter Score (NPS)

    Customers rate their likelihood of recommending our company/product/service to a friend or colleague on a scale from 0 to 10, forming the basis of the Net Promoter Score (NPS).

    An NPS score of 50 or higher signifies excellent performance, indicating incredible customer loyalty and advocacy.

    Supporting KPIs:

    • Customer Satisfaction Score (CSAT)
    • Customer Effort Score (CES)
    • Customer Retention Rate

    2. Return on Investment (ROI)

    To calculate ROI, divide the net profit generated from an investment by its total cost, then multiply by 100 to express it as a percentage.

    Achieving an ROI of 5:1 or higher is considered good, indicating that the benefits derived from data analytics outweigh the costs invested.

    Supporting KPIs:

    • Cost per Lead (CPL)
    • Customer Lifetime Value (CLTV)
    • Conversion Rate

    3. Employee Engagement Score

    Employee engagement surveys collect feedback on job satisfaction, motivation, and loyalty, with scores calculated from survey responses.

    An engagement score of 75% or higher indicates high employee satisfaction, motivation, and commitment to organizational goals.

    Supporting KPIs:

    • Employee Net Promoter Score (eNPS)
    • Employee Satisfaction Index
    • Employee Turnover Rate

    4. Technology Adoption Rate

    The technology adoption rate is calculated by dividing the number of users who have adopted a new technology by the total number of potential users, multiplying by 100 to express it as a percentage.

    A 90% or higher technology adoption rate indicates widespread adoption and effective utilization of digital technologies across the organization.

    Supporting KPIs:

    • User Engagement Rate
    • Active Users
    • Churn Rate

    5. Process Efficiency Score

    A process efficiency score is calculated by evaluating the time, resources, and effort required to complete a specific process or task and comparing it to benchmarks or historical data.

    A process efficiency score of 80 or higher indicates streamlined operations, reduced waste, and optimized workflows.

    Supporting KPIs:

    • Cycle Time
    • Throughput
    • Resource Utilization

    6. Employee Satisfaction Index

    The employee satisfaction index is calculated based on responses to employee satisfaction surveys, in which employees rate various aspects of their work environment, job role, and company culture.

    A 90% or higher retention rate indicates strong employee satisfaction, loyalty, and retention within the organization.

    Supporting KPIs:

    • Job Satisfaction Score
    • Employee Net Promoter Score (eNPS)
    • Employee Turnover Rate

    7. Organizational Agility Score

    Organizational agility score is assessed through qualitative and quantitative measures, including the organization’s ability to respond to market changes, innovate, and adapt quickly.

    Achieving an organizational agility score of 8 or higher on a scale of 1-10 indicates the organization’s ability to adapt quickly to market changes, innovate, and seize opportunities.

    Supporting KPIs:

    • Time to Market
    • Project Success Rate
    • Agile Maturity Index

    8. Marketing ROI

    Marketing ROI is calculated by dividing the net profit generated from marketing activities by the total marketing investment, then multiplying by 100 to express it as a percentage.

    Achieving an ROI of 3:1 or higher indicates that marketing efforts generate significant returns relative to the investment, driving business growth and profitability.

    Supporting KPIs:

    • Customer Acquisition Cost (CAC)
    • Customer Lifetime Value (CLTV)
    • Marketing Qualified Leads (MQLs)

    9. Cybersecurity Incident Rate

    Cybersecurity incident rate is calculated by dividing the number of cybersecurity incidents or breaches by the total number of users or systems, then multiplying by 100 to express it as a percentage.

    Responding to cyber incidents within 24 hours or less minimizes potential damage, data breaches, and operational disruptions.

    Supporting KPIs:

    • Mean Time to Detect (MTTD)
    • Mean Time to Respond (MTTR)
    • Security Vulnerability Assessment Score

    9. Brand Recognition Score

    Brand recognition score is assessed through surveys, brand recall tests, and market research to measure the level of awareness and recognition of a brand among target audiences.

    Maintaining a brand recognition score of 90% or higher indicates strong brand recall and awareness among target audiences

    Supporting KPIs:

    • Brand Awareness
    • Brand Recall Rate
    • Share of Voice (SOV)
  • 8 Surprising Truths About Digital Transformation You Need to Know

    8 Surprising Truths About Digital Transformation You Need to Know


    Failed digital transformation realities are seen perfectly in Neapolitan ice cream. I’m being serious! If you’ve ever had it, you know that the carton proudly displays chocolate, strawberry, and vanilla, all separated by vibrant, clean lines. You also know that it becomes brown and mushy as soon as it melts.

    The point is clear: the digital transformation landscape resembles melted Neapolitan ice cream. It’s filled with grand narratives that, more often than desired, blur the lines between perception and reality.

    Disappointing reality, I might add!

    Those with overly optimistic (note, I didn’t say naive… yet) or pessimistic views often promote these grand narratives and set unrealistic expectations for the rest of us.

    In this article, I aim to take a step toward setting the record straight.

    Strategy Development in Digital Transformation

    At Structure, we like to take a realistic view. One I’d call Strategic.

    It’s not overly optimistic or pessimistic but perfectly balanced between the reality of your organization’s desired outcomes and obstacles.

    Successful digital transformation requires a deep understanding of your perceived “digital transformation realities” and a clear vision for your future. Only with this view will you successfully define a tailored path to advance in our ever-changing digital world.

    Identifying the truth amidst common beliefs and misconceptions requires a strategic understanding of digital transformation.

    Look beyond the hype and consider the broader strategic, cultural, and operational impacts of your digital initiatives.

    To help you keep those lines clean and clear (instead of blurry), here’s a look at some factual statements about digital strategy that might be promoted as false, and vice versa, based on common misconceptions and naive (there, I said it) or pessimistic views.

    True Statements About Digital Strategy Often Considered False

    No BS.

    Nobody wants to discuss these truths, especially not a digital agency or consultant who might get your business—because they’re hard!

    But those people are just setting a trap of failed expectations and burned bridges. Here’s the honest info you need to know.

    1. Digital Transformation Can Sometimes Decrease Efficiency Initially

    The initial stages of implementing new digital technologies can lead to disruptions and a temporary decrease in efficiency.

    This adjustment period is necessary for long-term gains but might be viewed skeptically.

    2. Small and Medium-sized Enterprises (SMEs) Can Lead in Digital Innovation

    It’s a common misconception that only large corporations can afford to innovate digitally.

    In reality, SMEs can often adopt and benefit from new technologies more quickly than larger, more bureaucratic organizations.

    3. Digital Transformation Requires Cultural Change, Not Just Technological

    The belief that digital transformation is purely about technology is widespread.

    However, true transformation also requires a shift in organizational culture, which can be more challenging and is often underestimated.

    4. Technology Adoption Doesn’t Automatically Translate to Competitive Advantage

    Simply adopting new technology doesn’t guarantee a competitive edge.

    The strategic application of technology, aligned with business goals and customer needs, creates a real advantage.

    False Statements About Digital Strategy Often Considered True

    Let’s get real. These false statements are the ones that get all the headlines and hype. They’re what everyone is talking about.

    1. Artificial Intelligence (AI) Will Replace Most Human Jobs:

    The fear that AI and automation will lead to widespread job losses is common.

    While AI will undoubtedly change the nature of many jobs, it’s also expected to create new roles and opportunities, complementing human abilities rather than replacing them outright.

    2. Digital Transformation Is Primarily About Investing in New Technologies

    There’s a misconception that spending on the latest technologies is the essence of digital transformation.

    In reality, the transformation is more about rethinking old operating models and becoming more agile, customer-focused, and adaptable.

    3. The More Data a Company Collects, the Better Its Decision-Making Will Be

    The assumption that more data automatically leads to better decisions ignores data quality, relevance, and analysis complexities.

    Decision-making can be impaired by information overload or relying on poorly interpreted data.

    4. Blockchain Technology Is Only Useful for Cryptocurrencies

    Blockchain’s association with cryptocurrencies has overshadowed its other applications.

    However, the technology has potential uses across various industries, including supply chain management, healthcare, and digital identity verification.

  • Debunking 8 Common Myths of Digital Transformation & Technology Adoption

    Debunking 8 Common Myths of Digital Transformation & Technology Adoption

    It’s common to believe common digital transformation myths. Most promote an easy process, or worse, that digital transformation is a one-and-done deal that guarantees perfect results.

    Many organizational leaders fear planning or budgeting for digital transformation—often for a good reason—so they downplay the effort involved through generalized myths instead of personalized facts.

    Unfortunately, some common myths we hear (conveniently listed below)—especially the more optimistic ones—are often presented without substantial evidence. They often overlook the complexity and nuance involved in achieving such a goal.

    The Painful Problem with Digital Transformation

    No matter what you’ve heard, digital transformation is more than implementing the latest technology. It’s rarely a one-and-done process, and your team may not always welcome it.

    That said, if you’re considering any level of digital transformation for your organization, you will only succeed by identifying strategies to solve your unique problems and charting a course for success.

    To help you avoid them as you consider your approach, here are some of people’s most common myths regarding digital transformation.

    Myth #1: Digital Transformation Guarantees Business Success

    The idea that merely adopting digital technologies will guarantee business success and growth is often overstated. Success depends on numerous factors, including:

    • Strategic alignment of digital initiatives with business goals,
    • Organizational culture and
    • Customer needs…

    … not just technology adoption.

    Myth #2: Technology Adoption Leads to Immediate Productivity Gains

    It’s commonly asserted that new technologies will lead to immediate and significant increases in productivity. That’s usually the goal!

    However, productivity gains can take time as organizations adjust to new systems and employees learn to utilize new tools effectively.

    Pro Tip: Follow the 10-80-10 Rule

    When we work with clients on their digital transformation, we typically communicate the 10-80-10 rule upfront, so expectations are clear that integration and optimization will be involved.

    If you’re not familiar with the 10-80-10 rule, it’s this:

    • Initiation: the first 10% of the project will require your initiation
    • Implementation: 80% of the project can be done by an implementation team
    • Integration: the last 10% of the work will require your integration and involvement to reach your goals

    Myth #3: Digital Tools Always Enhance Customer Experience

    The assumption that digital tools automatically lead to better customer experiences can be misleading.

    The effectiveness of digital tools in enhancing customer experience depends on their thoughtful application, the customer base’s specific needs and preferences, and the quality of the digital experience provided.

    Pro Tip: Use A/B Testing to Validate Results

    When transforming your digital presence or digital strategy in a way that affects your Customer Experience (CX), we always recommend testing first.

    Our Conversion Rate Optimization packages are perfect for this. While we’ve seen skyrocket results from new digital transformation tools or strategies, we’ve also seen “fall-off-the-cliff” results. Both had good intentions and projections of success.

    The only way to know before going all-in is to test before you deploy.

    Myth #4: AI and Automation Will Inevitably Lead to Job Losses

    Predictions about AI and automation leading to widespread job losses tend to be speculative. Let’s be honest.

    These assertions may not account for creating new job categories or the potential for technology to augment human work rather than replace it entirely.

    Either way, we believe those who learn to use Artificial Intelligence (AI) and Automation—and use it frequently—will outpace and outperform those who don’t.

    Myth #5: All Companies Can Equally Benefit from Digital Transformation

    You’ll hear this from an “agency” or “digital marketing expert” who wants to sell everyone on their service.

    The ones you can trust are willing to say “no” for your sake.

    This assertion overlooks the diversity of businesses and industries, including their unique challenges, regulatory environments, and customer demands.

    The cold, hard truth is that the benefits of digital transformation can vary widely depending on many factors, including the company’s maturity, sector, and technology’s strategic implementation.

    Pro Tip: Assess the Opportunity Before Investing

    To achieve your digital transformation goals, evaluating your organization’s current state and identifying future needs is crucial to determining the best path forward.

    A strategic digital transformation assessment should look at five different components of your digital infrastructure:

    1. Strategy
    2. Technology
    3. Data
    4. Process
    5. Culture

    Successful digital transformation begins with a fundamental understanding of your business’s state, competition, technologies, opportunities, and overall business goals—along with potential barriers to achieving them.

    Myth #6: Data Is Always a Source of Competitive Advantage

    While data can provide valuable insights and competitive advantages, simply collecting large amounts of data is insufficient.

    You have to know what to do with it.

    The ability to derive actionable insights and effectively leverage data is the sign of a mature company—and requires the right analytics tools, skills, and data governance practices.

    Myth #7: The More Technology, the Better

    It’s so easy in today’s digital age to slap a new piece of technology on a problem without considering the positive or negative effects it might have on your goals.

    The notion that more technology leads to better outcomes is a recipe for failure.

    Sometimes, a more streamlined and focused digital strategy can be more effective. Aka, less technology but better.

    Consider the complexities of technology integration, including interoperability, security, and user adoption.

    Myth #8: Digital Transformation Is a One-Time Process

    This assertion fails to recognize that digital transformation is an ongoing process of evolution rather than a one-time project.

    Much like your brand is a living, breathing thing that evolves and improves over time—it’s the same with your digital presence.

    Technologies and market conditions continue to change, requiring continuous adaptation and investment. Take a “continuous improvement” approach from the get-go, and you’ll have a much better digital transformation experience.